SpringBoot监控神器——Actuator 保姆级教程
配置Actuator
pom.xml
<!– web start–>
<dependency>
<groupId>org.springframework.boot</groupId>
<artifactId>spring-boot-starter-web</artifactId>
</dependency>
<!– web end–>
<!– actuator start–>
<dependency>
<groupId>org.springframework.boot</groupId>
<artifactId>spring-boot-starter-actuator</artifactId>
</dependency>
<!– actuator end–>
http://localhost:8080/actuator//actuator
/actuator/health
/actuator/health/{component}
/actuator/health/{component}/{instance}
/actuator/info
http://localhost:8080/actuator/beans-
引入上述的依赖jar
management:
endpoints:
web:
exposure:
include: “*”
health,info,metrics等-
应用配置类 :可以查看应用在运行期的静态信息:例如自动配置信息、加载的 springbean 信息、yml 文件配置信息、环境信息、请求映射信息; -
度量指标类 :主要是运行期的动态信息,例如堆栈、请求连、一些健康指标、metrics 信息等; -
操作控制类 :主要是指 shutdown,用户可以发送一个请求将应用的监控功能关闭。
| GET | /auditevents | 显示应用暴露的审计事件 (比如认证进入、订单失败) |
|---|---|---|
| GET | /beans | 描述应用程序上下文里全部的 Bean,以及它们的关系 |
| GET | /conditions | 就是 1.0 的 /autoconfig ,提供一份自动配置生效的条件情况,记录哪些自动配置条件通过了,哪些没通过 |
| GET | /configprops | 描述配置属性(包含默认值)如何注入Bean |
| GET | /env | 获取全部环境属性 |
| GET | /env/{name} | 根据名称获取特定的环境属性值 |
| GET | /flyway | 提供一份 Flyway 数据库迁移信息 |
| GET | /liquidbase | 显示Liquibase 数据库迁移的纤细信息 |
| GET | /health | 报告应用程序的健康指标,这些值由 HealthIndicator 的实现类提供 |
| GET | /heapdump | dump 一份应用的 JVM 堆信息 |
| GET | /httptrace | 显示HTTP足迹,最近100个HTTP request/repsponse |
| GET | /info | 获取应用程序的定制信息,这些信息由info打头的属性提供 |
| GET | /logfile | 返回log file中的内容(如果 logging.file 或者 logging.path 被设置) |
| GET | /loggers | 显示和修改配置的loggers |
| GET | /metrics | 报告各种应用程序度量信息,比如内存用量和HTTP请求计数 |
| GET | /metrics/{name} | 报告指定名称的应用程序度量值 |
| GET | /scheduledtasks | 展示应用中的定时任务信息 |
| GET | /sessions | 如果我们使用了 Spring Session 展示应用中的 HTTP sessions 信息 |
| POST | /shutdown | 关闭应用程序,要求endpoints.shutdown.enabled设置为true |
| GET | /mappings | 描述全部的 URI路径,以及它们和控制器(包含Actuator端点)的映射关系 |
| GET | /threaddump | 获取线程活动的快照 |
/actuator/health 和 /actuator/info。可以在配置文件中设置打开。management:
endpoints:
web:
exposure:
include: “*”
management:
endpoints:
web:
exposure:
exclude: beans,trace
/actuator/*,当然如果有需要这个路径也支持定制。management:
endpoints:
web:
base-path: /manage #记得要加上/
/manage/*-
health
http://localhost:8080/actuator/health即可看到应用的状态。{
“status” : “UP”
}
management.endpoint.health.show-details 的值为always,配置之后我们再次访问http://localhost:8080/actuator/health,获取的信息如下:{
“status”: “UP”,
“components”: {
“diskSpace”: {
“status”: “UP”,
“details”: {
“total”: 236510507008,
“free”: 223361744896,
“threshold”: 10485760
}
},
“ping”: {
“status”: “UP”
}
}
}
ApplicationContext中的各种HealthIndicator Beans中收集到的,Spring boot框架中包含了大量的HealthIndicators的实现类,当然你也可以实现自己认为的健康状态。HealthAggregator汇总而成的,汇总的算法是:-
设置状态码顺序: setStatusOrder(Status.DOWN, Status.OUT_OF_SERVICE, Status.UP, Status.UNKNOWN);。 -
过滤掉不能识别的状态码。 -
如果无任何状态码,整个 Spring Boot 应用的状态是 UNKNOWN。 -
将所有收集到的状态码按照 1 中的顺序排序。 -
返回有序状态码序列中的第一个状态码,作为整个 Spring Boot 应用的状态。
HealthIndicators 目前包括:| CassandraHealthIndicator | Checks that a Cassandra database is up. |
|---|---|
DiskSpaceHealthIndicator |
Checks for low disk space. |
DataSourceHealthIndicator |
Checks that a connection to DataSource can be obtained. |
ElasticsearchHealthIndicator |
Checks that an Elasticsearch cluster is up. |
InfluxDbHealthIndicator |
Checks that an InfluxDB server is up. |
JmsHealthIndicator |
Checks that a JMS broker is up. |
MailHealthIndicator |
Checks that a mail server is up. |
MongoHealthIndicator |
Checks that a Mongo database is up. |
Neo4jHealthIndicator |
Checks that a Neo4j server is up. |
RabbitHealthIndicator |
Checks that a Neo4j server is up. |
RedisHealthIndicator |
Checks that a Redis server is up. |
SolrHealthIndicator |
Checks that a Solr server is up. |
RedisHealthindicator 将被当作检查的一部分;如果使用 MongoDB,那么MongoHealthIndicator 将被当作检查的一部分。management:
health:
redise:
enabled: false
-
自定义 HealthIndicator 健康检查
HealthIndicator的接口来实现,并将该实现类注册为spring bean。你需要实现其中的health()方法,并返回自定义的健康状态响应信息,该响应信息应该包括一个状态码和要展示详细信息。例如,下面就是一个接口HealthIndicator的实现类:@Component
public class MyHealthIndicator implements HealthIndicator {
@Override
public Health health() {
int errorCode = check(); // perform some specific health check
if (errorCode != 0) {
return Health.down().withDetail(“Error Code”, errorCode).build();
}
return Health.up().build();
}
}
HealthAggregator ,或者通过配置 management.health.status.order 来继续使用HealthAggregator的默认实现。HealthIndicator的实现类中,使用了自定义的状态类型FATAL,为了配置该状态类型的严重程度,你需要在application的配置文件中添加如下配置:management:
health:
status:
order: FATAL, DOWN, OUT_OF_SERVICE, UNKNOWN, UP
OUT_OF_SERVICE 和 DOWN 对应 503)。同样,你也需要为自定义的状态类型设置对应的HTTP状态码,例如,下面的配置可以将 FATAL 映射为 503(服务不可用):management:
health:
status:
http-mapping:
FATAL: 503
| Status | Mapping |
|---|---|
| OUT_OF_SERVICE | SERVICE_UNAVAILABLE (503) |
| DOWN | SERVICE_UNAVAILABLE (503) |
| UP | No mapping by default, so http status is 200 |
| UNKNOWN | No mapping by default, so http status is 200 |
info
info:
app:
name:
spring-boot-actuator
version: 1.0.0
test: test
http://localhost:8080/actuator/info返回部分信息如下:{
“app”: {
“name”: “spring-boot-actuator”,
“version”: “1.0.0”,
“test”:”test”
}
}
beans
http://localhost:8080/actuator/beans返回部分信息如下:[
{
“context”: “application:8080:management”,
“parent”: “application:8080”,
“beans”: [
{
“bean”: “embeddedServletContainerFactory”,
“aliases”: [
],
“scope”: “singleton”,
“type”: “org.springframework.boot.context.embedded.tomcat.TomcatEmbeddedServletContainerFactory”,
“resource”: “null”,
“dependencies”: [
]
},
{
“bean”: “endpointWebMvcChildContextConfiguration”,
“aliases”: [
],
“scope”: “singleton”,
“type”: “org.springframework.boot.actuate.autoconfigure.EndpointWebMvcChildContextConfiguration$$EnhancerBySpringCGLIB$$a4a10f9d”,
“resource”: “null”,
“dependencies”: [
]
}
}
]
conditions
http://localhost:8080/actuator/conditions返回部分信息如下:{
“positiveMatches”: {
“DevToolsDataSourceAutoConfiguration”: {
“notMatched”: [
{
“condition”: “DevToolsDataSourceAutoConfiguration.DevToolsDataSourceCondition”,
“message”: “DevTools DataSource Condition did not find a single DataSource bean”
}
],
“matched”: [ ]
},
“RemoteDevToolsAutoConfiguration”: {
“notMatched”: [
{
“condition”: “OnPropertyCondition”,
“message”: “@ConditionalOnProperty (spring.devtools.remote.secret) did not find property ‘secret'”
}
],
“matched”: [
{
“condition”: “OnClassCondition”,
“message”: “@ConditionalOnClass found required classes ‘javax.servlet.Filter’, ‘org.springframework.http.server.ServerHttpRequest’; @ConditionalOnMissingClass did not find unwanted class”
}
]
}
}
}
heapdump
http://localhost:8080/actuator/heapdump会自动生成一个 Jvm 的堆文件 heapdump,我们可以使用 JDK 自带的 Jvm 监控工具 VisualVM 打开此文件查看内存快照。类似如下图: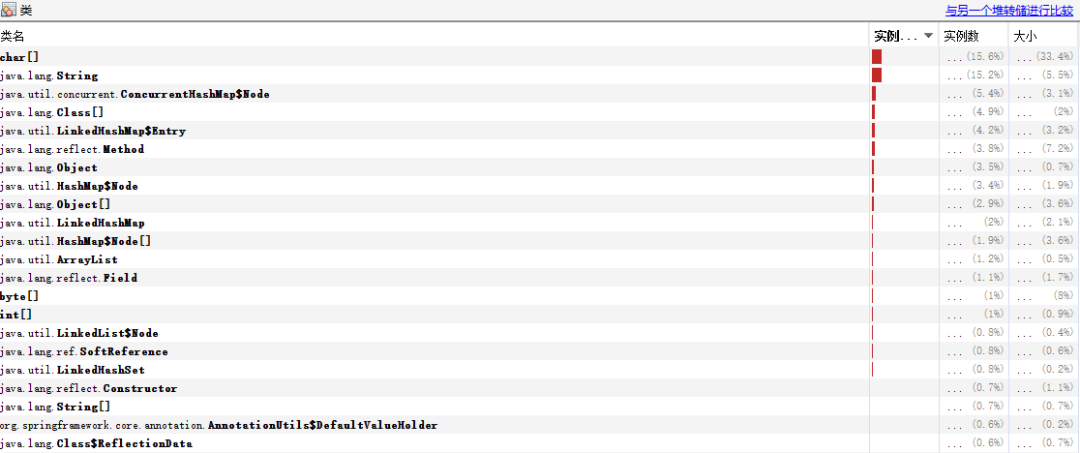
shutdown
management:
endpoint:
shutdown:
enabled: true
curl -X POST “http://localhost:8080/actuator/shutdown”
{
“message”: “Shutting down, bye…”
}
mappings
http://localhost:8080/actuator/mappings返回部分信息如下:{
“/**/favicon.ico”: {
“bean”: “faviconHandlerMapping”
},
“{[/hello]}”: {
“bean”: “requestMappingHandlerMapping”,
“method”: “public java.lang.String com.neo.controller.HelloController.index()”
},
“{[/error]}”: {
“bean”: “requestMappingHandlerMapping”,
“method”: “public org.springframework.http.ResponseEntity<java.util.Map<java.lang.String, java.lang.Object>> org.springframework.boot.autoconfigure.web.BasicErrorController.error(javax.servlet.http.HttpServletRequest)”
}
}
threaddump
/threaddump 接口会生成当前线程活动的快照。这个功能非常好,方便我们在日常定位问题的时候查看线程的情况。主要展示了线程名、线程ID、线程的状态、是否等待锁资源等信息。http://localhost:8080/actuator/threaddump返回部分信息如下:[
{
“threadName”: “http-nio-8088-exec-6”,
“threadId”: 49,
“blockedTime”: -1,
“blockedCount”: 0,
“waitedTime”: -1,
“waitedCount”: 2,
“lockName”: “java.util.concurrent.locks.AbstractQueuedSynchronizer$ConditionObject@1630a501”,
“lockOwnerId”: -1,
“lockOwnerName”: null,
“inNative”: false,
“suspended”: false,
“threadState”: “WAITING”,
“stackTrace”: [
{
“methodName”: “park”,
“fileName”: “Unsafe.java”,
“lineNumber”: -2,
“className”: “sun.misc.Unsafe”,
“nativeMethod”: true
},
…
{
“methodName”: “run”,
“fileName”: “TaskThread.java”,
“lineNumber”: 61,
“className”: “org.apache.tomcat.util.threads.TaskThread$WrappingRunnable”,
“nativeMethod”: false
}
…
],
“lockInfo”: {
“className”: “java.util.concurrent.locks.AbstractQueuedSynchronizer$ConditionObject”,
“identityHashCode”: 372286721
}
}
…
]
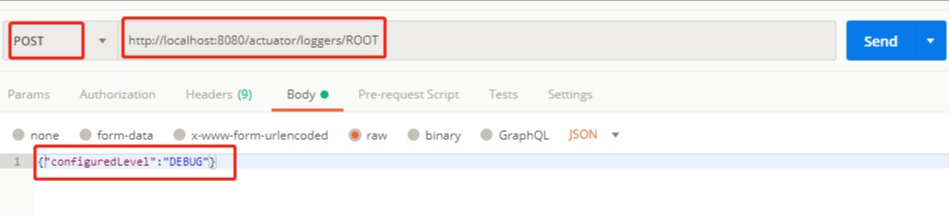
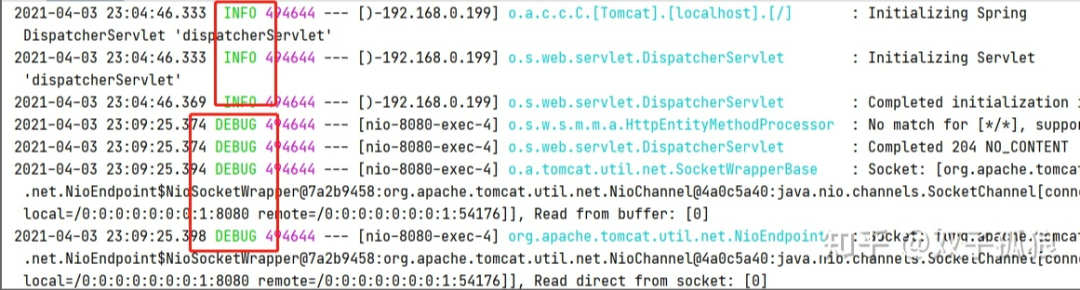
loggers 端点
http://localhost:8080/actuator/loggers 可以查看当前应用的日志级别等信息:
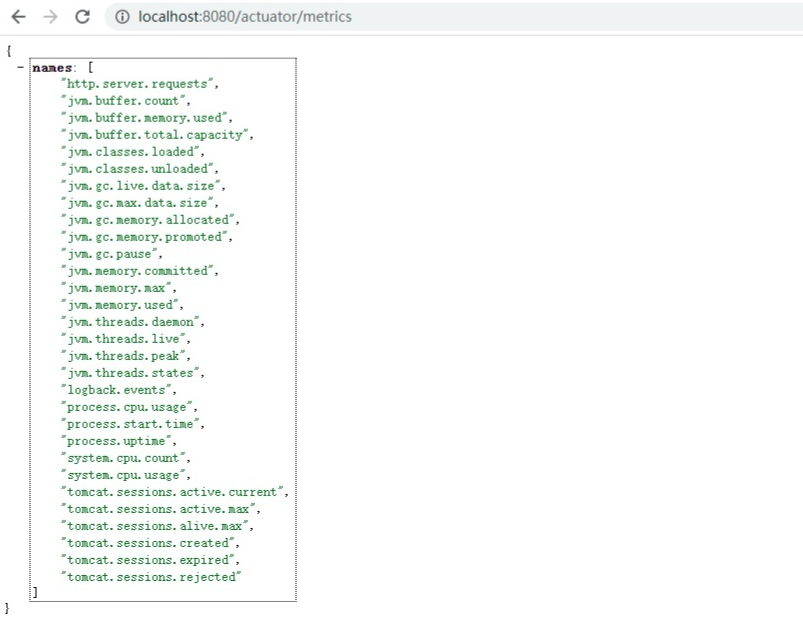
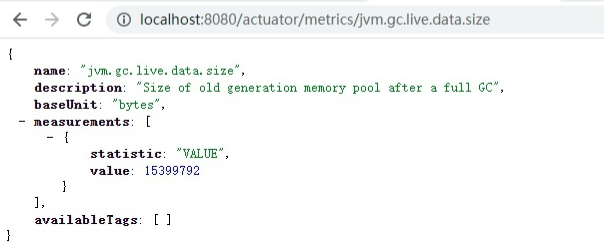
metrics 端点
自定义Endpoint
actuator:
filter:
switch: false
自定义监控端点常用注解
-
@Endpoint :定义一个监控端点,同时支持 HTTP 和 JMX 两种方式。 -
@WebEndpoint :定义一个监控端点,只支持 HTTP 方式。 -
@JmxEndpoint :定义一个监控端点,只支持 JMX 方式。
-
@ReadOperation :作用在方法上,可用来返回端点展示的信息(通过 Get 方法请求)。 -
@WriteOperation :作用在方法上,可用来修改端点展示的信息(通过 Post 方法请求)。 -
@DeleteOperation :作用在方法上,可用来删除对应端点信息(通过 Delete 方法请求)。 -
@Selector :作用在参数上,用来定位一个端点的具体指标路由。
-
使用 @Endpoint注解相应的类,作为Actuator的一个endpoint。注解要指定id,这个id作为访问路径,比如这里是/actuator/super; -
@ReadOperation来注解查询接口,如果要根据路径做查询,要用@Selector注解方法参数;注意这地方是@Selector String arg0,这个arg0不能改变,改成其他的,开放出去的接口还是/{arg0},这就导致你的方法无法正常获取参数值。 -
@WriteOperation来注解修改接口,注意请求数据必须是json,而且参数不像controller中那么灵活,不能将实体作为参数,要把实体中相应的属性拿出来做参数。 -
这里在增加用户时,往request里放一个user对象。
package com.cff.springbootwork.actuator.endpoint;
import java.util.Map;
import java.util.Set;
import java.util.concurrent.ConcurrentHashMap;
import javax.servlet.http.HttpServletRequest;
import org.springframework.boot.actuate.endpoint.annotation.Endpoint;
import org.springframework.boot.actuate.endpoint.annotation.ReadOperation;
import org.springframework.boot.actuate.endpoint.annotation.Selector;
import org.springframework.boot.actuate.endpoint.annotation.WriteOperation;
import org.springframework.web.context.request.RequestContextHolder;
import org.springframework.web.context.request.ServletRequestAttributes;
@Endpoint(id = “super”)
public class SuperEndPoint {
private Map<String, SuperUser> users = new ConcurrentHashMap<>();
@ReadOperation
public Set<String> users() {
return users.keySet();
}
@ReadOperation
public SuperUser usersIdentify(@Selector String arg0) {
return users.get(arg0);
}
@WriteOperation
public Set<String> set(String userName, String passwd) {
HttpServletRequest request = ((ServletRequestAttributes) RequestContextHolder.getRequestAttributes())
.getRequest();
if (request != null) {
SuperUser superUser = new SuperUser();
superUser.setUserName(userName);
superUser.setPasswd(passwd);
request.getSession().setAttribute(“superUser”, superUser);
users.put(superUser.getUserName(), superUser);
}
return users.keySet();
}
public static class SuperUser {
private String userName;
private String passwd;
public String getUserName() {
return userName;
}
public void setUserName(String userName) {
this.userName = userName;
}
public String getPasswd() {
return passwd;
}
public void setPasswd(String passwd) {
this.passwd = passwd;
}
}
}
package com.cff.springbootwork.actuator;
import org.springframework.boot.actuate.autoconfigure.endpoint.condition.ConditionalOnEnabledEndpoint;
import org.springframework.boot.web.servlet.ServletComponentScan;
import org.springframework.context.annotation.Bean;
import org.springframework.context.annotation.Configuration;
import com.cff.springbootwork.actuator.endpoint.SuperEndPoint;
@Configuration
@ServletComponentScan
public class MvcEndPointConfig {
@Bean
@ConditionalOnEnabledEndpoint
public SuperEndPoint superEndPoint() {
return new SuperEndPoint();
}
}
使用Filter对访问actuator做限制
-
对 /actuator/*下所有路径做过滤,并用actuator.filter.switch属性对filter做开关; -
如果时 /actuator/super路径的post操作,放行它,它将会往request中放一个对象; -
其他 /actuator/*下路径要判断request中有没有user对象,没有就返回错误提示。
package com.cff.springbootwork.actuator.filter;
import java.io.IOException;
import javax.servlet.Filter;
import javax.servlet.FilterChain;
import javax.servlet.FilterConfig;
import javax.servlet.ServletException;
import javax.servlet.ServletRequest;
import javax.servlet.ServletResponse;
import javax.servlet.annotation.WebFilter;
import javax.servlet.http.HttpServletRequest;
import javax.servlet.http.HttpServletResponse;
import org.springframework.beans.factory.annotation.Value;
import org.springframework.core.annotation.Order;
import org.springframework.http.HttpMethod;
import org.springframework.http.HttpStatus;
import org.springframework.http.MediaType;
import com.fasterxml.jackson.databind.ObjectMapper;
@WebFilter(urlPatterns = “/actuator/*”, filterName = “actuatorPermissionFilter”)
@Order(1) // 指定过滤器的执行顺序,值越大越靠后执行
public class ActuatorPermissionFilter implements Filter {
private String excludePath = “actuator/super”;
@Value(“${actuator.filter.switch}”)
Boolean actuatorSwitch;
@Override
public void init(FilterConfig filterConfig) {
}
@Override
public void doFilter(ServletRequest servletRequest, ServletResponse servletResponse, FilterChain filterChain)
throws IOException, ServletException {
HttpServletRequest request = (HttpServletRequest) servletRequest;
HttpServletResponse response = (HttpServletResponse) servletResponse;
if (actuatorSwitch && !(request.getRequestURI().endsWith(excludePath)
&& request.getMethod().equals(HttpMethod.POST.toString()))) {
Object user = request.getSession().getAttribute(“superUser”);
if (user == null) {
// 未登录,返回数据
ObjectMapper mapper = new ObjectMapper();
response.setStatus(HttpStatus.OK.value());
response.setContentType(MediaType.APPLICATION_JSON_UTF8_VALUE);
mapper.writeValue(response.getWriter(), “您没有权限访问该接口,请使用自定义的登录接口设置superUser后使用!”);
return;
}
}
filterChain.doFilter(servletRequest, servletResponse);
}
@Override
public void destroy() {
}
}
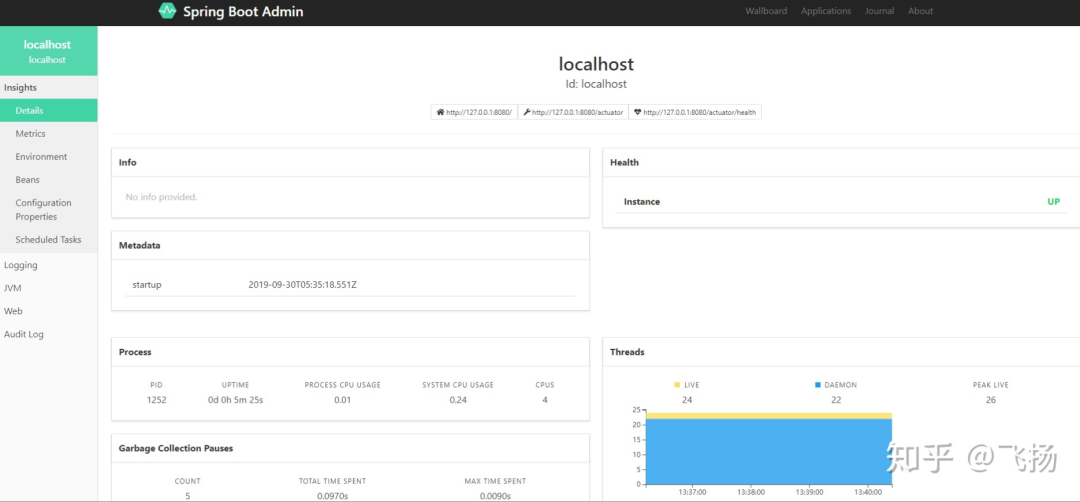
Spring Boot Monitor做监控页面
<dependency>
<groupId>cn.pomit</groupId>
<artifactId>spring-boot-monitor</artifactId>
<version>0.0.1</version>
</dependency>
-
Spring Boot Monitor官网:https://www.pomit.cn/SpringBootMonitor
http://127.0.0.1:8080/monitor, 自动跳转到Spring Boot Monitor的监控页面。
 微信赞赏
微信赞赏 支付宝扫码领红包