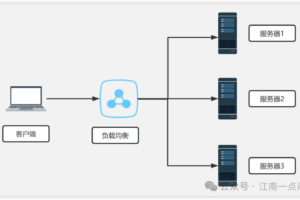
采用 Nginx+Promtail+Loki+Grafana 来做一个简单的 Nginx 日志展示
http_listen_port: 9080
grpc_listen_port: 0
positions:
filename: /tmp/positions.yaml
clients:
– url: http://localhost:3100/loki/api/v1/push
scrape_configs:
– job_name: nginx
pipeline_stages:
– replace:
expression: ‘(?:[0-9]{1,3}\.){3}([0-9]{1,3})’
replace: ‘***’
static_configs:
– targets:
– localhost
labels:
job: nginx_access_log
host: expatsxxxxs
agent: promtail
__path__: /var/log/nginx/expatshxxxxs.access.log
‘”msec”: “$msec”, ‘ # request unixtime in seconds with a milliseconds resolution
‘”connection”: “$connection”, ‘ # connection serial number
‘”connection_requests”: “$connection_requests”, ‘ # number of requests made in connection
‘”pid”: “$pid”, ‘ # process pid
‘”request_id”: “$request_id”, ‘ # the unique request id
‘”request_length”: “$request_length”, ‘ # request length (including headers and body)
‘”remote_addr”: “$remote_addr”, ‘ # client IP
‘”remote_user”: “$remote_user”, ‘ # client HTTP username
‘”remote_port”: “$remote_port”, ‘ # client port
‘”time_local”: “$time_local”, ‘
‘”time_iso8601″: “$time_iso8601″, ‘ # local time in the ISO 8601 standard format
‘”request”: “$request”, ‘ # full path no arguments if the request
‘”request_uri”: “$request_uri”, ‘ # full path and arguments if the request
‘”args”: “$args”, ‘ # args
‘”status”: “$status”, ‘ # response status code
‘”body_bytes_sent”: “$body_bytes_sent”, ‘ # the number of body bytes exclude headers sent to a client
‘”bytes_sent”: “$bytes_sent”, ‘ # the number of bytes sent to a client
‘”http_referer”: “$http_referer”, ‘ # HTTP referer
‘”http_user_agent”: “$http_user_agent”, ‘ # user agent
‘”http_x_forwarded_for”: “$http_x_forwarded_for”, ‘ # http_x_forwarded_for
‘”http_host”: “$http_host”, ‘ # the request Host: header
‘”server_name”: “$server_name”, ‘ # the name of the vhost serving the request
‘”request_time”: “$request_time”, ‘ # request processing time in seconds with msec resolution
‘”upstream”: “$upstream_addr”, ‘ # upstream backend server for proxied requests
‘”upstream_connect_time”: “$upstream_connect_time”, ‘ # upstream handshake time incl. TLS
‘”upstream_header_time”: “$upstream_header_time”, ‘ # time spent receiving upstream headers
‘”upstream_response_time”: “$upstream_response_time”, ‘ # time spend receiving upstream body
‘”upstream_response_length”: “$upstream_response_length”, ‘ # upstream response length
‘”upstream_cache_status”: “$upstream_cache_status”, ‘ # cache HIT/MISS where applicable
‘”ssl_protocol”: “$ssl_protocol”, ‘ # TLS protocol
‘”ssl_cipher”: “$ssl_cipher”, ‘ # TLS cipher
‘”scheme”: “$scheme”, ‘ # http or https
‘”request_method”: “$request_method”, ‘ # request method
‘”server_protocol”: “$server_protocol”, ‘ # request protocol, like HTTP/1.1 or HTTP/2.0
‘”pipe”: “$pipe”, ‘ # “p” if request was pipelined, “.” otherwise
‘”gzip_ratio”: “$gzip_ratio”, ‘
‘”http_cf_ray”: “$http_cf_ray”,’
‘”geoip_country_code”: “$geoip_country_code”‘
‘}’;
{“msec”: “1633430998.709”, “connection”: “4”, “connection_requests”: “2”, “pid”: “29887”, “request_id”: “430fd53a457ea580c47e9b055da2b4d0”, “request_length”: “56”, “remote_addr”: “106.19.96.55”, “remote_user”: “”, “remote_port”: “43746”, “time_local”: “05/Oct/2021:18:49:58 +0800”, “time_iso8601”: “2021-10-05T18:49:58+08:00”, “request”: “GET /maps/api/js?ver=5.6.1 HTTP/2.0”, “request_uri”: “/maps/api/js?ver=5.6.1”, “args”: “ver=5.6.1”, “status”: “200”, “body_bytes_sent”: “41262”, “bytes_sent”: “41406”, “http_referer”: “https://www.expatsholidays.com/”, “http_user_agent”: “Mozilla/5.0 (iPhone; CPU iPhone OS 13_6 like Mac OS X) AppleWebKit/605.1.15 (KHTML, like Gecko) Version/13.1.2 Mobile/15E148 Safari/604.1”, “http_x_forwarded_for”: “”, “http_host”: “www.expatsholidays.com”, “server_name”: “www.expatsholidays.com”, “request_time”: “0.000”, “upstream”: “”, “upstream_connect_time”: “”, “upstream_header_time”: “”, “upstream_response_time”: “”, “upstream_response_length”: “”, “upstream_cache_status”: “”, “ssl_protocol”: “TLSv1.2”, “ssl_cipher”: “ECDHE-RSA-AES128-GCM-SHA256”, “scheme”: “https”, “request_method”: “GET”, “server_protocol”: “HTTP/2.0”, “pipe”: “.”, “gzip_ratio”: “3.06”, “http_cf_ray”: “”,”geoip_country_code”: “”}
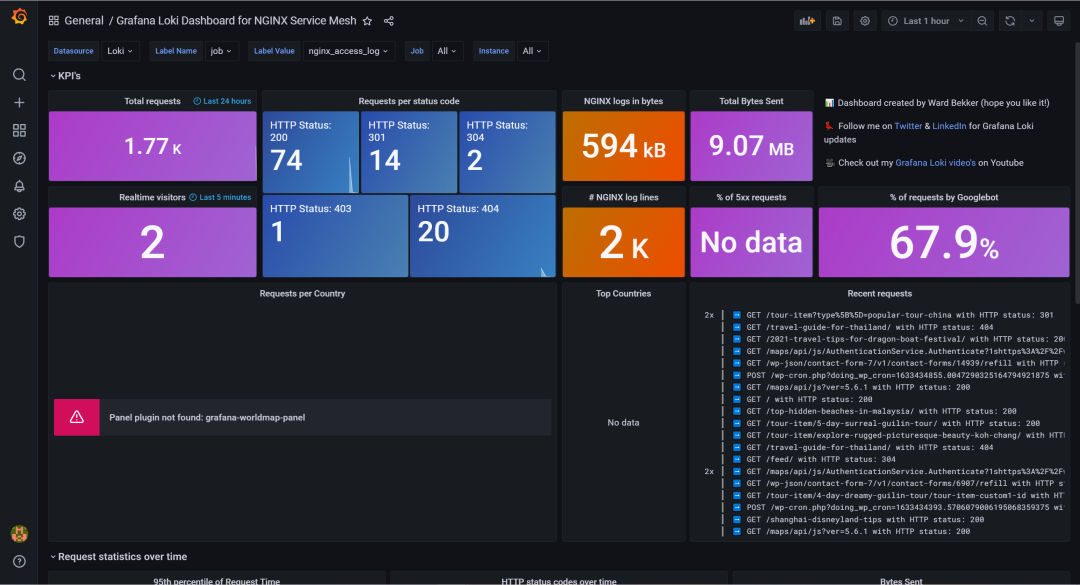
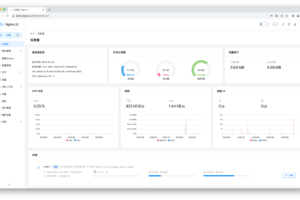
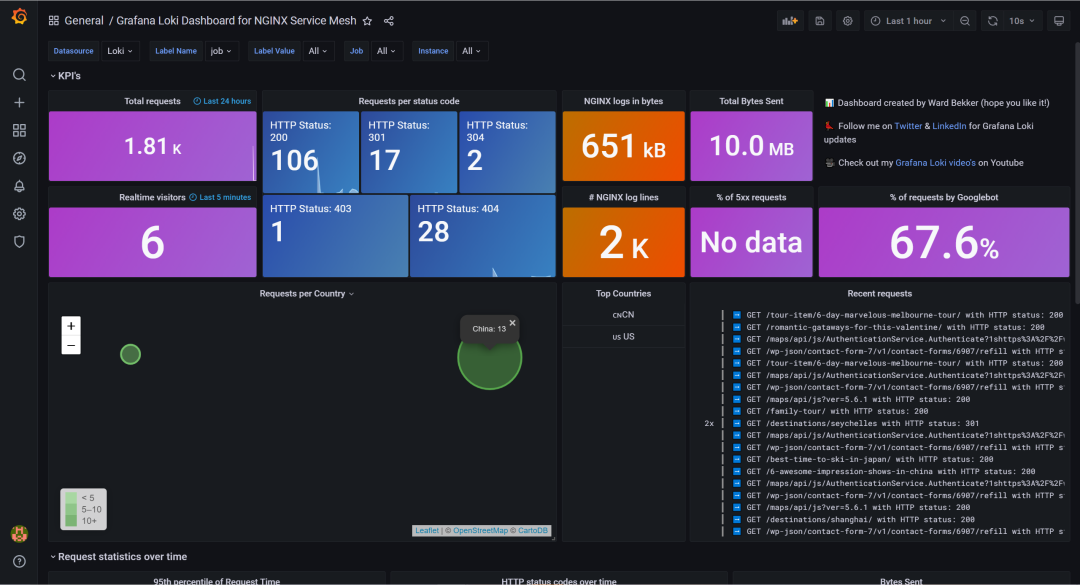
可以看到,这里地图没展示,缺少grafana-worldmap-panel插件,我们装一下,通过命令行
 微信赞赏
微信赞赏 支付宝扫码领红包
声明:本站所有文章,如无特殊说明或标注,均为本站原创发布。任何个人或组织,在未征得本站同意时,禁止复制、盗用、采集、发布本站内容到任何网站、书籍等各类媒体平台。如若本站内容侵犯了原著者的合法权益,可联系我们进行处理。侵权投诉:375170667@qq.com